CS/04 — MARKET RESEARCH · CONCEPT DESIGN · SERVICE DESIGNIDENTITIES WITHHELD. FOR SAFETY PURPOSES.
Using concept design to make an HVAC opportunity testable
DOMAIN — RESIDENTIAL HVACROLE — PRODUCT DESIGNER · RESEARCH COLLABORATORSCOPE — CUSTOMER TOUCHPOINT MAP · SERVICE BLUEPRINT · STORYBOARDS · CONCEPT WIREFRAMES · RAPID RESEARCH ITERATION
THE CHALLENGE
The client was exploring market opportunities in the HVAC-thermostat sector through nationwide qualitative and quantitative research. Technicians and homeowners needed something concrete enough to react to before a real product direction existed.
WHAT I CHANGED
I built a customer touchpoint map, low-fidelity product concepts, and detailed storyboards as research instruments, then revised them in real time as interviews and surveys exposed new questions.
WHAT BECAME POSSIBLE
The artifacts helped the team gather and interpret feedback across more than 80 interviews and 100+ surveys, turning abstract market questions into scenarios people could understand, challenge, and respond to.
THE ACTUAL BRIEF
The statement of work called for high-concept, low-fidelity design. The goal was not to define a production-ready thermostat application. It was to investigate where a manufacturer might create value for HVAC technicians and homeowners.
That distinction matters. These screens were not final answers wearing grayscale. They were research stimuli: specific enough to provoke useful reactions, provisional enough to change when the evidence did.
MAKING THE OPPORTUNITY VISIBLE
The research involved two audiences with different expertise, incentives, and moments of control. Technicians installed equipment, configured systems, documented work, explained the product, and returned when something failed. Homeowners participated in setup, managed comfort, granted access, and inherited the experience after the technician left.
Questions about trust, commissioning, permissions, documentation, troubleshooting, and handoff were difficult to investigate as feature lists. I translated them into three connected artifact types.
Customer touchpoint map
A detailed map combining the temporal clarity of a user journey with the operational layers of a service blueprint. It connected customer actions, technician actions, visible touchpoints, backstage processes, and opportunities across the service lifecycle — a shared structure for deciding where research needed to go deeper and where an intervention might matter.
Storyboards
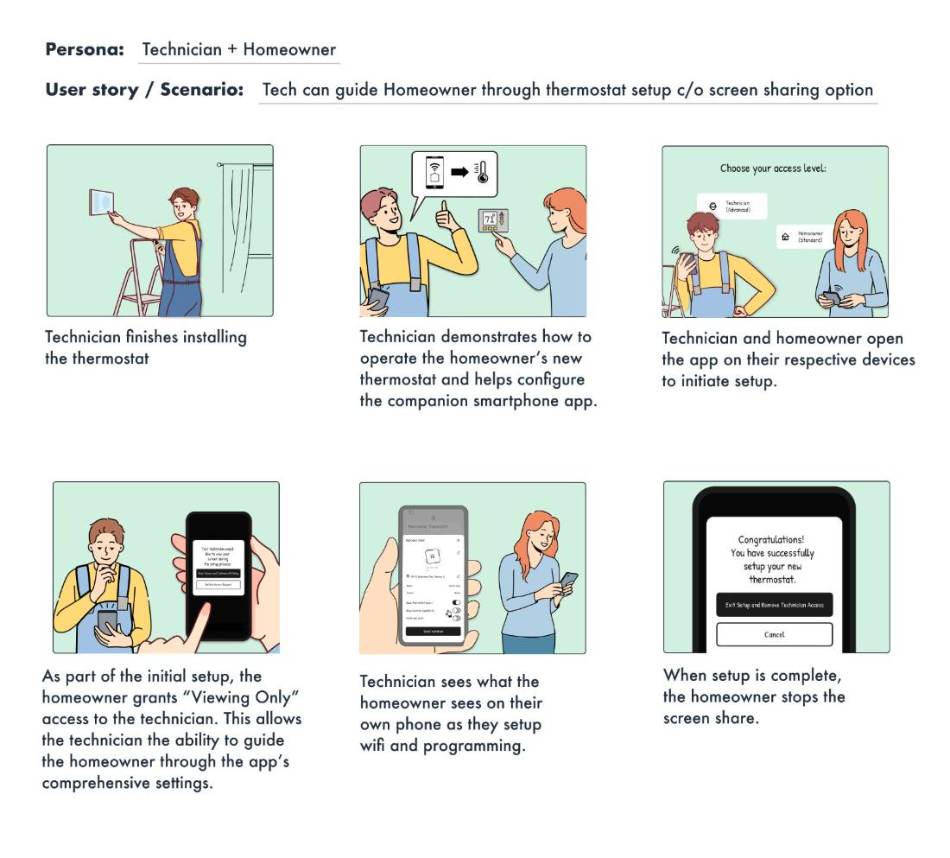
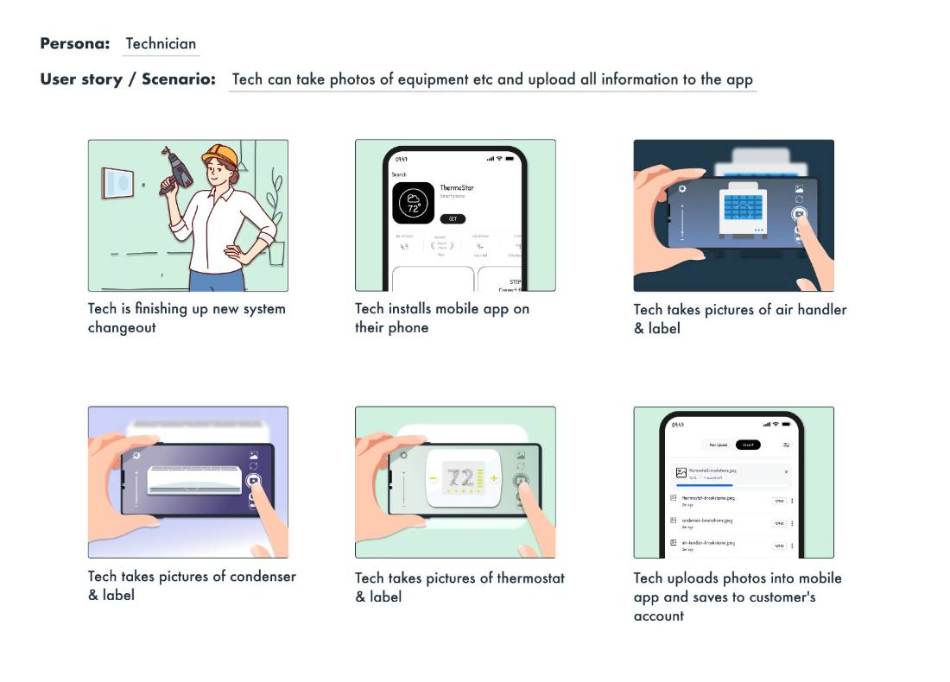
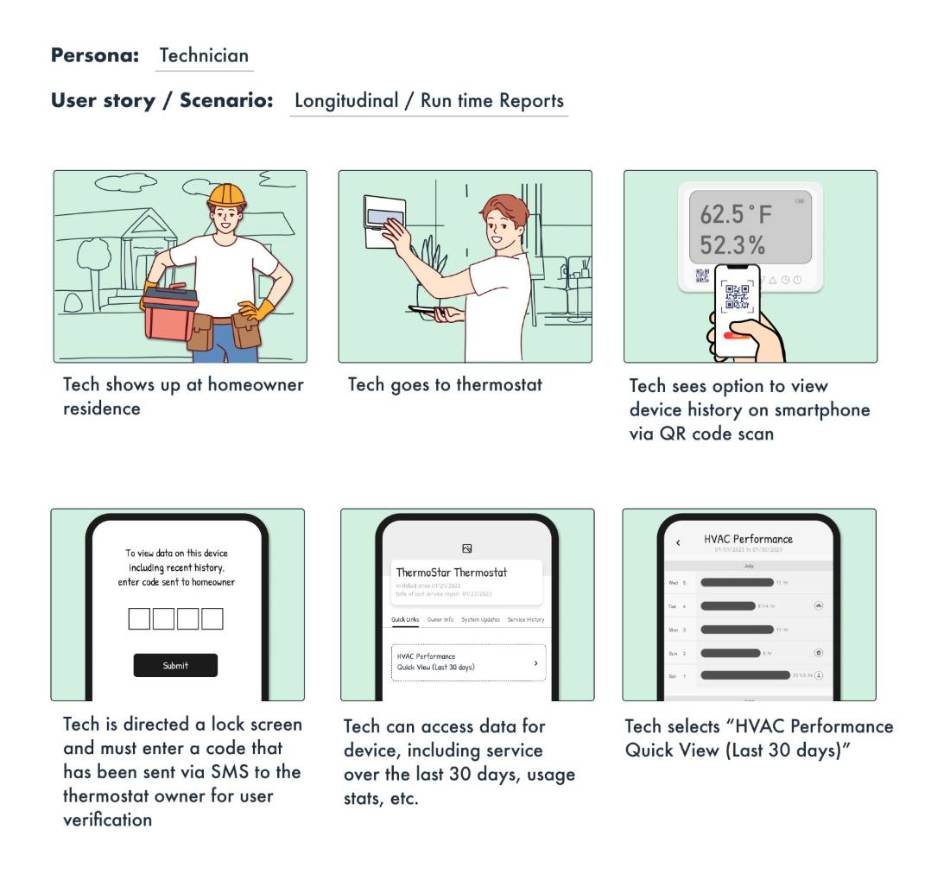
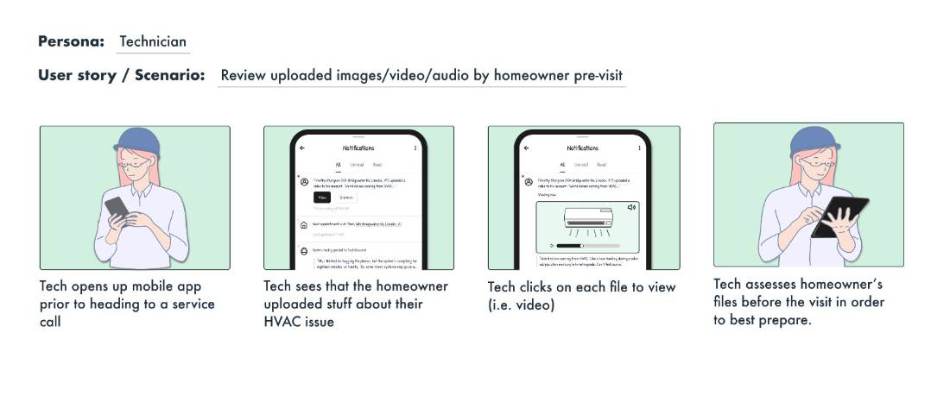
Detailed scenarios placed concepts inside recognizable moments: installing the thermostat, demonstrating setup, documenting equipment, arriving for a return visit, reviewing runtime data, and receiving homeowner-provided media before an appointment. Participants could react to the situation, responsibility, and value proposition before debating controls.
Concept wireframes
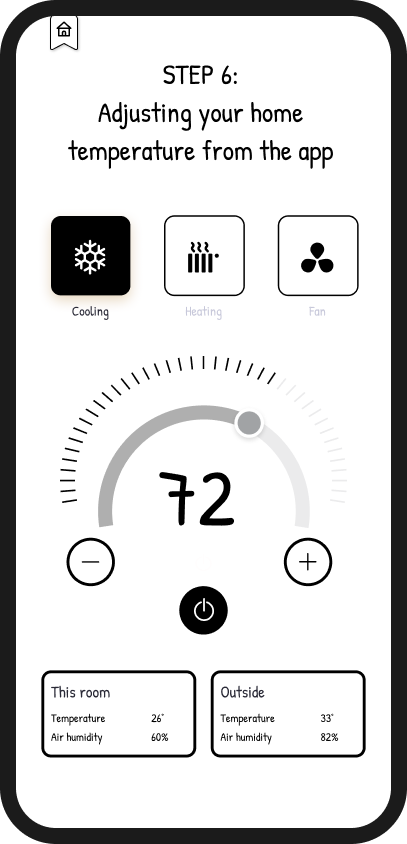
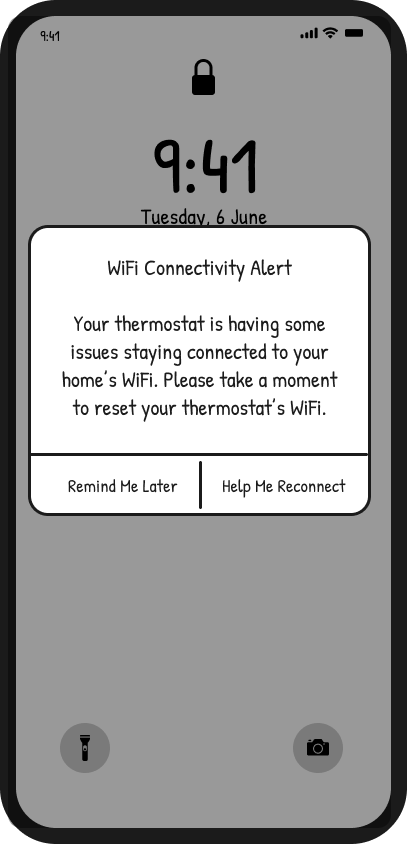
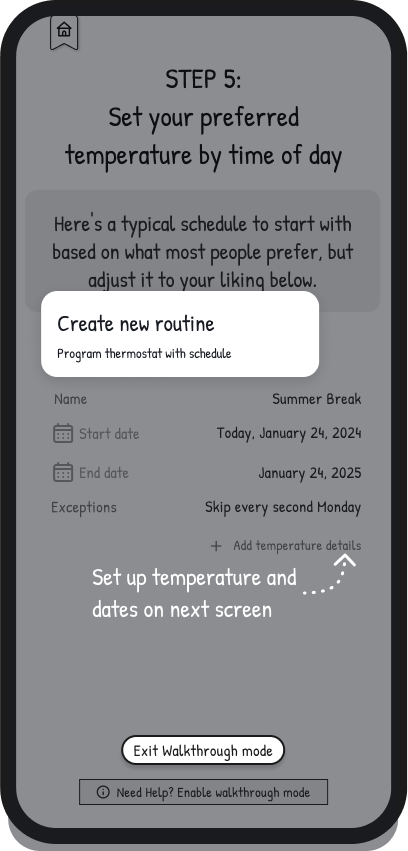
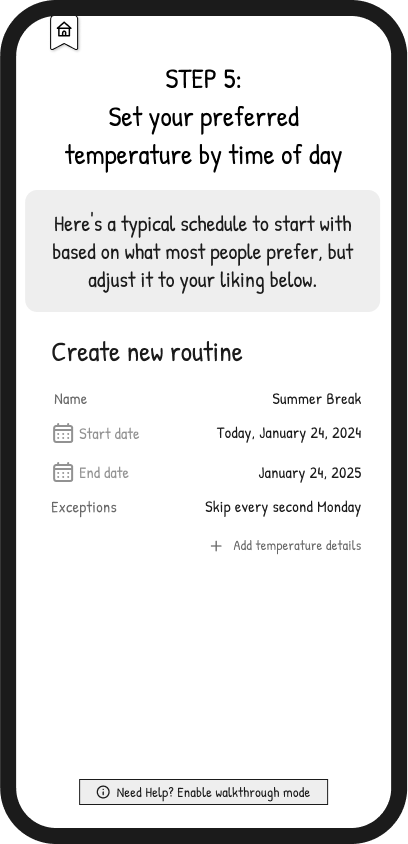
Low-fidelity flows made the proposed product tangible for both technicians and homeowners: guided installation, technical settings, Bluetooth-based Wi-Fi commissioning, permissions, documentation, runtime reports, and recovery states. Intentionally idyllic — not because every concept should be built, but because a coherent future experience made the opportunity easier to test.
THE RESEARCH LOOP
I participated directly in the research process by sitting in interviews and taking notes. With multiple interviews occurring daily and survey findings accumulating, the artifacts needed to change quickly. The working loop was simple:
Put a scenario, map, or wireframe in front of participants.
Listen for confusion, recognition, resistance, and unmet need.
Distill the finding into a clearer concept or a better question.
Revise the artifact for the next round.
That proximity to the research let me respond to emerging opportunities without waiting for a formal synthesis phase. Design gave form to the finding; the revised design uncovered the next one.
SELECTED RESEARCH STIMULI
FIG 01 — Install, demonstrate, transfer control: a storyboard testing how installation responsibility and product control might move from technician to homeowner.FIG 02 — Equipment documentation: a concept exploring whether structured equipment photos and labels could improve the service record before the technician left the property.FIG 03 — Return-visit access: QR scan, homeowner verification, and bounded runtime data used to test the value and trust implications of faster diagnosis.FIG 04 — Pre-visit context: homeowner-provided images, video, or audio used to explore whether technicians could arrive better prepared.
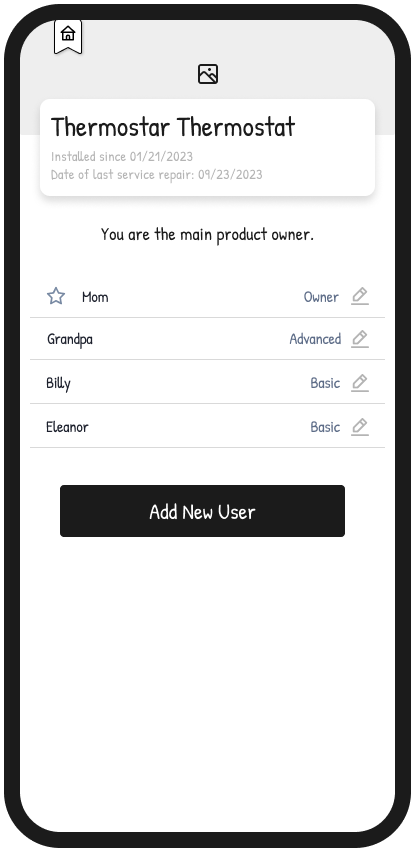
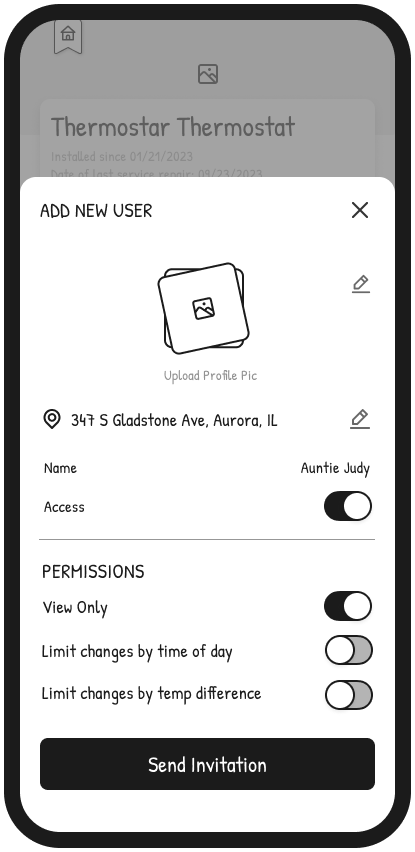
FIG 05 — Household permissions: role-based access used to test how different household members might share control without sharing identical authority.
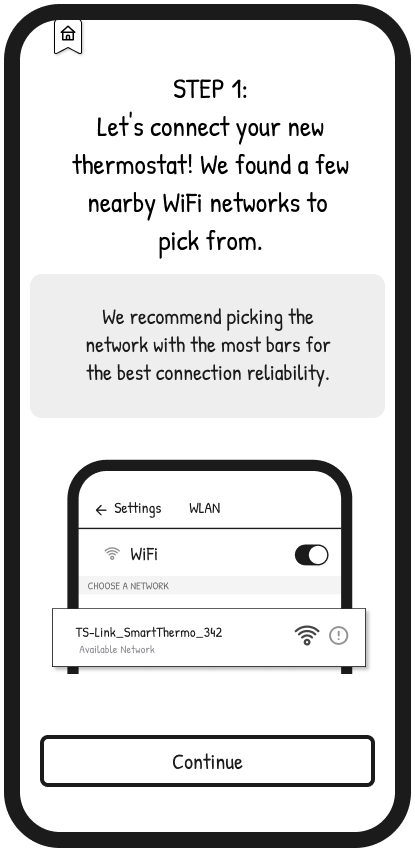
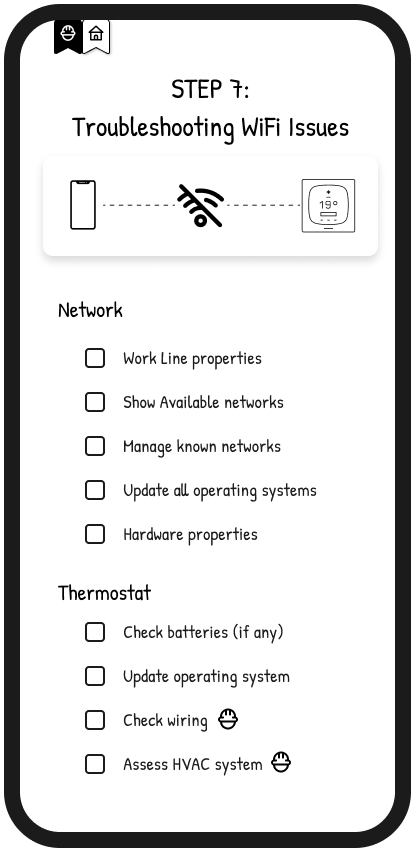
FIG 06 — Commissioning and recovery: Bluetooth pairing, Wi-Fi connection, confirmation, and troubleshooting used to probe where homeowners needed clarity or support.
PROCESS — LOW-FIDELITY CONCEPTS
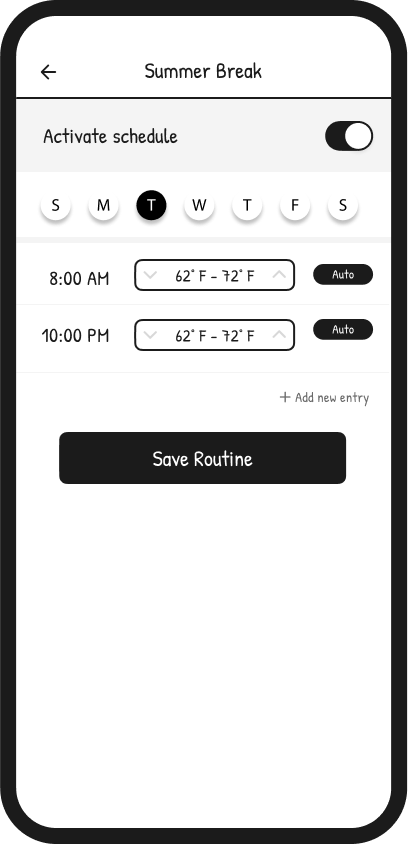
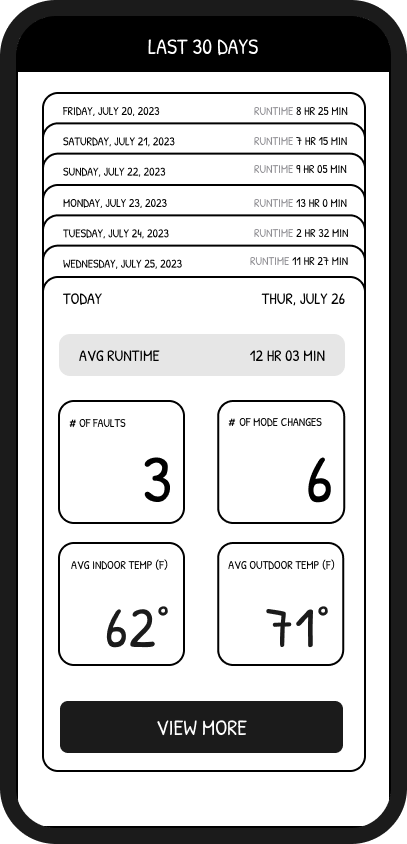
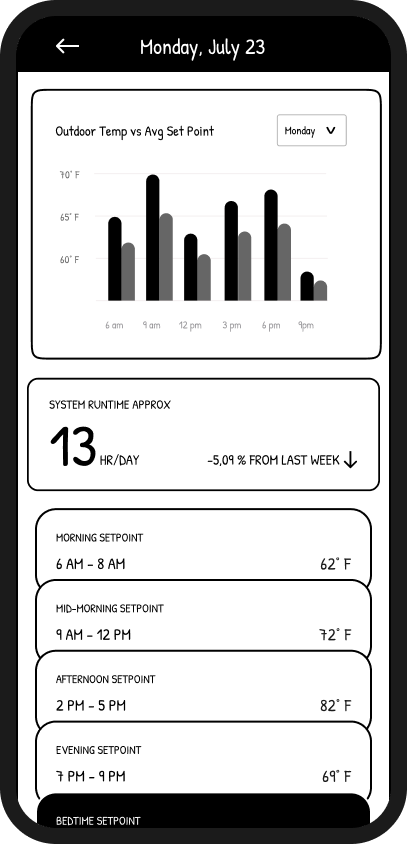
Walkthrough steps · failure notifications · schedules · runtime reports. Research instruments, not tiny final screens asking to be admired — shown at thinking-document scale.
WHAT THE ARTIFACTS HELPED INVESTIGATE
Handoff
Who holds the phone, who makes each decision, and when does control visibly change hands?
Automation and expertise
Where could generated settings accelerate a technician’s work without overriding professional judgment?
Trust and access
What should temporary technician access allow, how should homeowners understand it, and when should it end?
Documentation
Could photos, labels, runtime data, and pre-visit media reduce repeated diagnosis and support future service?
Failure and recovery
Which moments turned manageable setup into “Can you just do it for me?” and what information could prevent that handoff of frustration?
THE OUTCOME
The touchpoint map, storyboards, and concept wireframes supported a nationwide mixed-method research effort involving more than 80 interviews and 100+ surveys. They helped participants respond to concrete service situations and product possibilities rather than abstract questions about a hypothetical thermostat.
The artifacts evolved with the research and helped the team gather detailed feedback from both customers and technicians. The result was not a prescribed product roadmap. It was a better-evidenced understanding of where the market opportunity might be and which assumptions deserved further investment.
KEY TAKEAWAY
Sometimes the product designer’s job is not to design the answer. It is to make the question concrete enough for people to answer.
Research artifacts are sanitized recreations. Participant data, client naming, and internal terminology have been removed.